Quantcast
Channel: mayhemer's blog

Backtrack meets Gecko Profiler

$
0
0

Backtrack is about to be a new performance tool, focused on revealing and solving scheduling and delay problems.  Those are big offenders of performance, very hard to track, and hidden from conventional profilers.

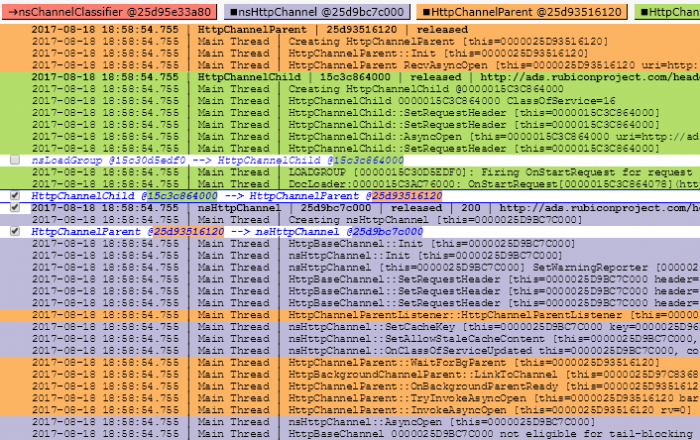
To find out how long and what all has to happen to reach a certain point – an objective, just add a simple instrumentation marker.  When hit during run, it’s added to a list you can then pick from and start tracing to its origin.  Backtrack follows from the selected objective back to the originating user input event that has started the whole processing chain.

The walk-back crosses runnables and their wait time in thread event queues, but also network requests and responses, any code specific queues such as DOM mutations, scheduled reflows or background JS parsing 1), monitor and condvar notifications, mutex acquirements 2), and disk I/O operations.

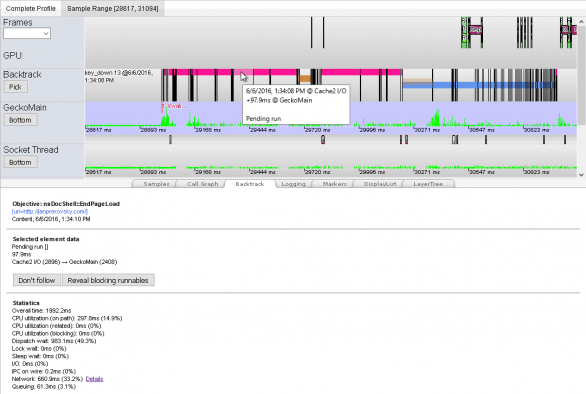
Visually the result is a single timeline – we can call it a critical path – revealing wait, network and CPU times as distinct intervals involved in reaching solely the selected objective.  Spotting mainly dispatch wait delays is then very easy.  The most important and new is that Backtrack tells you what other operations or events block (makes the critical path wait) and where from have been scheduled.  And more importantly, it recognizes which of them are (or are not) related to reaching the selected objective.  Those not related are then clear candidates for rescheduling.

To distinguish related and unrelated operations Backtrack captures all sub-tasks that are involved in reaching the selected objective.  Good example is the page first paint time – actually unsuppress of painting.  First paint is blocked by loading more than one resource, the HTML and head referenced CSS and JS.  These loads and their processing – the sub-tasks – happen in parallel and only completion of all of them unsuppresses the painting (said in a very simplified way, of course.)  Each such sub-task’s completion is marked with an added instrumentation.  That creates a list of sub-objectives that are then added to the whole picture.

Screen shot of how Backtrack is integrated to the Gecko Profiler Cleopatra web UI

Future improvements:

  • Backtrack could be used in our perfomance automation.  Except calculation of time between an objective and its input source event, it can also calculate CPU vs dispatch delays vs network response time.  It could also be able to filter out code paths clean of any outer jitter.
  • Indeed, networking has strong influence to load times.  Adding more detailed breakdown and analyzes how well we schedule and allocate network resources is one of the next steps.
  • Adding PCAPs or even let Backtrack capture network activity like Wireshark directly from inside Firefox and join it with the Gecko Profiler UI might help too.

The current state of Backtrack development is a work in active progress and is not yet available to users of Gecko Profiler.  There are patches for Gecko, but also for the Cleopatra UI and the Gecko Profiler Add-on.  The UI changes, where also the analyzes happens, are mostly prototype-like and need a clean up.  There are also problems with larger memory consumption and bigger chances to hit OOMs when processing the captured data with Backtrack captured markers.


1) code specific queues need to be manually instrumented
2) with ability to follow to the thread that was keeping the mutex for the time you were waiting to acquire it


The post Backtrack meets Gecko Profiler appeared first on mayhemer's blog.


Illusion of atomic reference counting

$
0
0

Most people believe that having an atomic reference counter makes them safe to use RefPtr on multiple threads without any more synchronization.  Opposite may be truth, though!

Imagine a simple code, using our commonly used helper classes, RefPtr<> and an object Type with ThreadSafeAutoRefCnt reference counter and standard AddRef and Release implementations.

Sounds safe, but there is a glitch most people may not realize.  See an example where one piece of code is doing this, no additional locks involved:

RefPtr<Type> local = mMemeber; // mMember is RefPtr<Type>, holding an object

And other piece of code then, on a different thread presumably:

mMember = new Type(); // mMember's value is rewritten with a new object

Usually, people believe this is perfectly safe.  But it’s far from it.

Just break this to actual atomic operations and put the two threads side by side:

Thread 1

local.value = mMemeber.value;
/* context switch */ 
.
.
.
.
.
.
local.value->AddRef();

Thread 2

.
.
Type* temporary = new Type();
temporary->AddRef();
Type* old = mMember.value; 
mMember.value = temporary; 
old->Release(); 
/* context switch */ 
.

Similar for clearing a member (or a global, when we are here) while some other thread may try to grab a reference to it:

RefPtr<Type> service = sService;
if (!service) {
  return; // service being null is our 'after shutdown' flag
}

And another thread doing, usually during shutdown:

sService = nullptr; // while sService was holding an object

And here what actually happens:

Thread 1

local.value = sService.value;
/* context switch */
.
.
.
.
local.value->AddRef();

Thread 2

.
.
Type* old = sService.value; 
sService.value = nullptr; 
old->Release(); 
/* context switch */
.

And where is the problem?  Clearly, if the Release() call on the second thread is the last one on the object, the AddRef() on the first thread will do its job on a dying or already dead object.  The only correct way is to have both in and out assignments protected by a mutex or, ensure that there cannot be anyone trying to grab a reference from a globally accessed RefPtr when it’s being finally released or just being re-assigned. The letter may not always be easy or even possible.

Anyway, if somebody has a suggestion how to solve this universally without using an additional lock, I would be really interested!

The post Illusion of atomic reference counting appeared first on mayhemer's blog.

Moz logging (former NSPR logging) file now has a size limit option

$
0
0

There are lot of cases of mainly networking issues rare enough to reproduce making users have their Firefox run for long hours to hit the problem.  Logging is great in bringing the information to us when finally reproduced, but after few hours the log file can be – well – huge.  Easily even gigabytes.

But now we have a size limit, all you need to do:

Adding rotate module to the list of modules will engage log file size limit:

MOZ_LOG=rotate:200,log modules...

The argument is the limit in megabytes.

This will produce up to 4 files with names appended a numbering extension, .0, .1, .2, .3.  The logging back end cycles the files it writes to while sum of these files’ sizes will never go over the specified limit.

The patch just landed on mozilla-central (version 51), bug 1244306.

Note 1: the file with the largest number is not guarantied to be the last file written.  We don’t move the files, we only cycle.  Using the rotate module automatically adds timestamps to the log, so it’s always easy to recognize which file keeps the most recent data.

Note 2: rotate doesn’t support append.  When you specify rotate, on every start all the files (including any previous non-rotated log file) are deleted to avoid any mixture of information.  The append module specified is then ignored.

The post Moz logging (former NSPR logging) file now has a size limit option appeared first on mayhemer's blog.

Intel Rapid Storage Technology disappears on Windows 10 and more

$
0
0

This started with the INACCESSIBLE_BOOT_DEVICE doom I wrote about before.  But here I want to treat the story after that.

When I solved the above mentioned problem, I ended up with 14.6 version of the driver in the system.  Everything worked well.

Until few months ago, the Intel Rapid Storage Technology UI completely disappeared from my system.  Only an empty folder under Program Files left.  Like somebody would steal it… Despite that, it still was listed as an installed software in Control Panels.

Since the UI part is important, I decided to gain it back.

But before running any SetupRST installers I rather inspected and prepared the system.  And what I found to my surprise!  The Intel’s driver for the RAID storage was missing.  I was on the Microsoft’s one (EhStorClass.sys).  That was very interesting thing I didn’t expect.

The preparation part #1 – create a restore point!

And preparation part #2 – check that restore point is accessible from the Recovery mode.  And here it starts :)  Pressing F8 during Windows 10 boot no longer works.  Hence, on this very same machine, I created a restore USB drive.  Booted from it.  Trying to access the list of restore points – “first select a system.”  What?  Aha!  The system drive didn’t mount in the Recovery mode!  This means that there is something wrong with this affected system.  But I don’t have intentions finding out what.

Fortunately, having a laptop with Windows 10 helped here.  That laptop didn’t have iRST installed, ever.  Creating a restore drive on a different machine and booting back on the ill machine makes the list of restore points visible.  Now I can proceed.

I decided to install only the iRST UI.  As reported in the original blog post comments, 14.0.0.1143 version is considered safe to install regarding the INACCESSIBLE_BOOT_DEVICE error.  Hence, I downloaded the setup from Intel.

Running it started to complain that iRST was already installed.  I exited the setup and uninstalled the iRST using Control Panels.  Then restarted with fingers crossed.  And the system… booted!  And the Microsoft’s driver didn’t move a bit.

Next step.  Running the setup again, now it complains that there is a newer Intel Rapid Storage driver, version 14.6.x.x.  If it’s there and it used to work, then why not to keep it?

Hence, this time I run SetupRST with -Nodrv command line argument to don’t install the driver.  According to my understanding, it should only install the missing UI.  Setup installs, asks for restart.  I do it, and the system… still boots!

The Intel Rapid Storage Technology UI is there after boot, as used to be!  There is also still the Microsoft driver.  The iRST UI works with it as expected and is also able to check the volume for errors.  Nice.

But somehow I’d rather have iRST UI, the service and the driver from one company.  One never knows if when changing the volume parameters like changing the drives, enlarging etc would break in any bad combination.

Hence, I run SetupRST again, no arguments.  It asks for either uninstall or repair.  I choose repair.  It does its job, asks for reboot.  I do it, and the system… yes, still boots :)

The final result: I have both the iRST driver and the iRST UI back.
User interface version:  14.0.0.1143
Driver version:  14.6.0.1029

This seems to work well.  I can again see status of all volumes and disks, and hopefully also manage volumes safely as before.

I hope this may help anyone experiencing iRST UI being mysteriously ripped off the Windows 10 system.

The post Intel Rapid Storage Technology disappears on Windows 10 and more appeared first on mayhemer's blog.

Automatically attaching child and test-spawned Firefox processes in Visual Studio IDE

$
0
0

Did you ever dream of debugging Firefox in Visual Studio with all its child processes attached automatically?  And also when being started externally from a test suit like mochitest or browsertest?  Tired of finding the right pid and time to attach manually?  Here is the solution for you!

Combination of the following two extensions to Visual Studio Community 2015 will do the trick:

  1. Spawned Process Catcher X – attaches automatically to all child processes the debugee (and its children) spawns
  2. Entrian Attach – attaches the IDE automatically to an instance of a process spawned FROM ANYWHERE, e.g. when running tests via mach where Firefox is started by a python script – yes, magic happens ;)

Spawned Process Catcher X works automatically after installation without a need for any configuration.

Entrian Attach is easy to configure: In the IDE, in the main menu go to TOOLS/Entrian Attach: Configuration…, you’ll get the following window:

UPDATE: It’s important to enter the full path for the executable.  The Windows API for capturing process spawning is stupid – it only takes name of an executable, not a full path or wildchars.  Hence you can only specify names of executable files you want Entrian Attach to automatically attach to.  Obviously, when Visual Studio is running with Entrian Attach enabled and you start your regular browser, it will attach too.  I’ve added a toolbar button EntrianAttachEnableDisable to the standard toolbar for a quick switch and status visibility.

Other important option is to set Attach at process start when to “I’m not already debugging its exe”.  Otherwise, when firefox.exe is started externally, a shim process is inserted between the parent and a child process which breaks our security and other checks for expected pid == actual pid.  You would just end up with a MOZ_CRASH.

Note that the extension configuration and the on/off switch are per-solution.

Entrian Attach developer is very responsive.  We’ve already cooked the “When I’m not already debugging its exe” option to allow child process attaching without the inserted shim process, took just few days to release a fixed version.

Entrian Attach is a shareware with 10-day trial.  Then a single developer license is for $29.  There are volume discounts available.  Hence, since this is so super-useful, Mozilla could consider buying a multi-license.  Anyway, I believe it’s money very well spent!

The post Automatically attaching child and test-spawned Firefox processes in Visual Studio IDE appeared first on mayhemer's blog.

Mozilla Log Analyzer added basic network diagnostics

$
0
0

Mozilla Log Analyzer objects search results

Few weeks ago I’ve published Mozilla Log Analyzer (logan).  It is a very helpful tool itself when diagnosing our logs, but looking at the log lines doesn’t give answers about what’s wrong or right with network requests scheduling.  Lack of other tools, like Backtrack, makes informed decisions on many projects dealing with performance and prioritization hard or even impossible.  The same applies to verification of the changes.

Hence, I’ve added a simple network diagnostics to logan to get at least some notion of how we do with network request and response parallelization during a single page load.  It doesn’t track dependencies, by means of where from exactly a request originates, like which script has added the DOM node leading to a new request (hmm… maybe bug 1394369 will help?) or what all has to load to satisfy DOMContentLoaded or early first paint.  That’s not in powers of logan right now, sorry, and I don’t much plan investing time in it.  My time will be given to Backtrack.

But what logan can give us now is a breakdown of all requests being opened and active before and during a request you pick as your ‘hero request.’  May tell you what the concurrent bandwidth utilization was during the request in question, or what lower priority requests have been scheduled, been active or even done before the hero request.  What requests were blocking the socket where your request was finally dispatched on, and so on…

To obtain this diagnostic breakdown, use the current Nightly (at this time its Firefox 57) and capture logs from the parent AND also child processes with the following modules set:

MOZ_LOG=timestamp,sync,nsHttp:5,cache2:5,DocumentLeak:5,PresShell:5,DocLoader:5,nsDocShellLeak:5,RequestContext:5,LoadGroup:5,nsSocketTransport:5

(sync is optional, but you never know.)

Make sure you let the page you are analyzing to load, it’s OK to cancel too.  It’s best to close the browser then and only after that load all the produced logs (parent + children) to logan.  Find your ‘hero’ nsHttpChannel.  Expand it and then click its breadcrumb at the top of the search results.  There is a small [ diagnose ] button at the top.  Clicking it brings you to the breakdown page with number of sections listing the selected channel and also all concurrent channels according few – I found interesting – conditions.

This all is tracked on github and open to enhancements.

The post Mozilla Log Analyzer added basic network diagnostics appeared first on mayhemer's blog.

Firefox 57 delays requests to tracking domains

$
0
0

Firefox Quantum – version 57 – introduced number of changes to the network requests scheduler.  One of them is using data of the Tracking Protection database to delay load of scripts from tracking domains when possible during the time a page is actively loading and rendering – I call it tailing.

This has a positive effect on page load performance as we save some of the network bandwidth, I/O and CPU for loading and processing of images and scripts running on the site so the web page is complete and ready sooner.

Tracking scripts are not disabled, we only delay their load for few seconds when we can.  Requests are kept on hold only while there are site sub-resources still loading and only up to about 6 seconds.  The delay is engaged only for scripts added dynamically or as async.  Tracking images and XHRs are always delayed, as well as any request made by a tracking script.  This is legal according all HTML specifications and it’s assumed that well built sites will not be affected regarding functionality.

To make it more clear what we exactly do for site and tracking requests, this is how scheduling roughly looks like when tailing is engaged:

Firefox Quantum Tracker Tailing OK

And here with the tailing turned off:

Firefox Quantum Tracker Tailing OFF

This is of course not without problems.  For sites that are either not well built or their rendering is influenced by scripts from tracking domains there can be a visible or even functional regression.  Simply said, some sites need to be fixed to be able to adopt this change in scheduling.

One example is Google’s Page-Hiding Snippet, which may cause a web page to be blank for whole 4 seconds since the navigation start.  What happens?  Google’s A/B testing initially hides the whole web page with opacity: 0.  The test script first has to do its job to prepare the page for the test and only then it unhides the page content.  The test script is dynamically loaded by the analytics.js script.  Both the analytics.js and the test script are loaded from www.google-analytics.com, a tracking domain, for which we engage the tailing delay.  As the result the page is blank until one of the following wins: 4 seconds timeout elapses or we load both the scripts and execute them.  For a common user this appears as a performance drawback and not a win.

Other example can be a web page referring an API of an async tracking script from a sync script, which obviously is a race condition, since there is no guarantee that an async script loads before a sync script.  There is a real life example of such not-well-built site using a Twitter API – window.twttr.  The twttr object is simply not there when the site’s script calls on it.  An exception is thrown and the rest of the site script is not executed breaking some of the page’s functionality.  That effected web page worked before tailing just because Twitter’s servers were fast to respond and executed sooner than the site script using the window.twttr object.  Hence, worked only by a lucky accident.  Note that sites with such race condition issues are 100% broken also when opened in Private Browsing windows or when Tracking Protection with just the default list is turned on.

To conclude on how useful the tailing feature is – unfortunately, at the moment I don’t have enough data to provide (it’s on its way, though.)  So far testing was made mostly locally and on our Web Page Test internal testing infrastructure.  The effect was unfortunately just hidden in the overall noise, hence more scientific and wide testing needs to be done.


EDIT: Interesting reactions on www.bleepingcomputer.com and Hacker News.


(Note: few somewhat off-topic comments have been trashed in case you wonder why they don’t appear here ; I will only accept comments bringing a benefit to discussion of this feature and its issues, thanks for understanding)

The post Firefox 57 delays requests to tracking domains appeared first on mayhemer's blog.

Fixing adb device unauthorized in VirtualBox hosted linux

$
0
0

Getting either no devices listed or just unauthorized from adb devices when running adb in a virtual machine? My setup is VirtualBox running Ubuntu 18.04 LTS hosted in Windows 10 machine. Connecting one of my Android devices with Lineage 16 and running adb in the VM doesn’t make the device ask for debugging authorization. When connecting with adb from the host machine, it does.

The solution is inspired by this stackoverflow post, with few modifications.

Prerequisites:

On both the host and the virtual machine make sure the version of adb is exactly the same. Otherwise the client will ask the server to restart and unexpectedly fail, when using the below provided solution.

For instance, Firefox for Android build uses internally adb version 1.0.41. But the system wide adb (up to date) in Ubuntu is 1.0.39. To download platform-tools for Windows, in my case, with that version you have to hack the URL bar a bit as there are no download links on the android site for older versions. Trial and error got me this link to get the tools with adb version 1.0.39 for Windows.

On the host machine:

  • Connect the device with USB debugging enabled, as usually
  • Don’t connect it in the running VirtualBox VM
  • Run adb devices to check the host machine sees the devices, check the server has started on port 5037

On the virtual machine:

  • Make sure the adb server is not running with adb kill-server
  • Check nothing listens on the 5037 port with netstat -nao | grep :5037
  • Run socat tcp-listen:5037,fork tcp:10.0.2.2:5037 where 10.0.2.2 should be the host address as seen from the VirtualBox VM
  • Run adb devices
  • You should see the same result as on the host machine and be able to work with the device now

The trick is to simply forward the TCP traffic between the two machines and pretend a server in the VM. It can work well the other way around with any kind of direct TCP relay in Windows, any kind of port and any IP address of choice.

I wrote this more for myself to not forget till next time, but maybe it will help someone.

The post Fixing adb device unauthorized in VirtualBox hosted linux appeared first on mayhemer's blog.


Visual Studio Code auto-complete displays MDN reference for CSS and HTML tags

$
0
0

Mozilla Developer Network (now MDN Web Docs) is great, probably the best Web development reference site from them all. And therefor even Microsoft defaults to us now in Visual Studio Code.

Snippet from they Release Notes for 1.38.0:

Languages

MDN Reference for HTML and CSS

VS Code now displays a URL pointing to the relevant MDN Reference in completion and hover of HTML & CSS entities:

HTML & CSS MDN Reference

We thank the MDN documentation team for their effort in curating mdn-data / mdn-browser-compat-data and making MDN resources easily accessible by VS Code.

The post Visual Studio Code auto-complete displays MDN reference for CSS and HTML tags appeared first on mayhemer's blog.

Firefox enables link rel=”preload” support

$
0
0

We enabled the link preload web feature support in Firefox 78, at this time only at Nightly channel and Firefox Early Beta and not Firefox Release because of pending deeper product integrity checking and performance evaluation.

What is “preload”

Web developers may use the the Link: <..>; rel=preload response header or <link rel="preload"> markup to give the browser a hint to preload some resources with a higher priority and in advance.

Firefox can now preload number of resource types, such as styles, scripts, images and fonts, as well as responses to be later used by plain fetch() and XHR. Use preload in a smart way to help the web page to render and get into the stable and interactive state faster.

Don’t misplace this for “prefetch”. Prefetching (with a similar technique using <link rel="prefetch"> tags) loads resources for the next user navigation that is likely to happen. The browser fetches those resources with a very low priority without an affect on the currently loading page.

Web Developer Documentation

There is a Mozilla provided MDN documentation for how to use <link rel="preload">. Definitely worth reading for details. Scope of this post is not to explain how to use preload, anyway.

Implementation overview

Firefox parses the document’s HTML in two phases: a prescan (or also speculative) phase and actual DOM tree building.

The prescan phase only quickly tokenizes tags and attributes and starts so called “speculative loads” for tags it finds; this is handled by resource loaders specific to each type. A preload is just another type of a speculative load, but with a higher priority. We limit speculative loads to only one for a URL, so only the first tag referring that URL starts a speculative load. Hence, if the order is the consumer tag and then the related <link preload> tag for the same URL, then the speculative load will only have a regular priority.

At the DOM tree building phase, during which we create actual consuming DOM node representations, the respective resource loader first looks for an existing speculative load to use it instead of starting a new network load. Note that except for stylesheets and images, a speculative load is used only once, then it’s removed from the speculative load cache.

Firefox preload behavior

Supported types

“style”, “script”, “image”, “font”, “fetch”.

The “fetch” type is for use by fetch() or XHR.

The “error” event notification

Conditions to deliver the error event in Firefox are slightly different from e.g. Chrome.

For all resource types we trigger the error event when there is a network connection error (but not a DNS error – we taint error event for cross-origin request and fire load instead) or on an error response from the server (e.g. 404).

Some resource types also fire the error event when the mime type of the response is not supported for that resource type, this applies to style, script and image. The style type also produces the error event when not all @imports are successful.

Coalescing

If there are two or more <link rel="preload"> tags before the consuming tag, all mapping to the same resource, they all use the same speculative preload – coalesce to it, deliver event notifications, and only one network load is started.

If there is a <link rel="preload"> tag after the consuming tag, then it will start a new preload network fetch during the DOM tree building phase.

Sub-resource Integrity

Handling of the integrity metadata for Sub-resource integrity checking (SRI) is a little bit more complicated. For <link rel=preload> it’s currently supported only for the “script” and “style” types.

The rules are: the first tag for a resource we hit during the prescan phase, either a <link preload> or a consuming tag, we fetch regarding this first tag with SRI according to its integrity attribute. All other tags matching the same resource (URL) are ignored during the prescan phase, as mentioned earlier.

At the DOM tree building phase, the consuming tag reuses the preload only if this consuming tag is either of:

  • missing the integrity attribute completely,
  • the value of it is exactly the same,
  • or the value is “weaker” – by means of the hash algorithm of the consuming tag is weaker than the hash algorithm of the link preload tag;
  • otherwise, the consuming tag starts a completely new network fetch with differently setup SRI.

As link preload is an optimization technique, we start the network fetch as soon as we encounter it. If the preload tag doesn’t specify integrity then any later found consuming tag can’t enforce integrity checking on that running preload because we don’t want to cache the data unnecessarily to save memory footprint and complexity.

Doing something like this is considered a website bug causing the browser to do two network fetches:

<link rel="preload" as="script" href="script1.js">
<script src="script1.js" integrity="sha512-....">

The correct way is:

<link rel="preload" as="script" href="script1.js" integrity="sha512-....">
<script src="script1.js">

Specification

The main specification is under W3C jurisdiction here. Preload is also weaved into the Fetch WHATWG specification.

The W3C specification is very vague and doesn’t make many things clear, some of them are:

  • What all types or minimal set of types the browser must or should support. This is particularly bad because specifying a type that is not supported is not firing neither load nor error event on the <link> tag, so a web page can’t detect an unsupported type.
  • What are the exact conditions to fire the error event.
  • How exactly to handle (coalesce) multiple <link rel="preload"> tags for the same resource.
  • How exactly, and if, to handle <link rel="preload"> found after the consuming tag.
  • How exactly to handle the integrity attribute on both the <link preload> and the consuming tag, specifically when it’s missing one of those or is different between the two. Then also how to handle integrity on multiple link preload tags.

The post Firefox enables link rel=”preload” support appeared first on mayhemer's blog.


Latest Images